I recently watched Alex Schultz’s lecture on Growth, and I was curious as to how triangle heatmaps would look with our own cohort data.
Fortunately, ggplot and R make it very easy to build heatmaps. The tricky bit turned out to be creating some fake data to show how they look.
First import (and install if needed) the key libraries.
library(ggplot2)
library(reshape)
Next, generate some test data, or load existing cohort data for your company.
# Generate decending values from 100 to 1 to simulate retention over time
rcohorts <- replicate(15, sort(runif(15, 1, 100), T))

# Make a triangle
rcohorts[lower.tri(rcohorts)] <- NA

# Convert to a data frame, and add tenure labels
rcohorts <- as.data.frame(rcohorts)
rcohorts$tenure <- seq(0,14)

# Reshape to suit ggplot, remove NAs, and sort the labels
rcohorts <- na.omit(melt(rcohorts, 'tenure', variable_name='cohort'))
rcohorts$cohort <- factor(rcohorts$cohort, levels=rev(levels(rcohorts$cohort)))
The data shows a particular value for a given cohort across a number of weeks.
head(rcohorts)
##    tenure cohort    value
## 1       0     V1 95.11190
## 16      0     V2 99.80269
## 17      1     V2 97.54479
## 31      0     V3 97.10274
## 32      1     V3 93.49820
## 33      2     V3 77.72841
Using ggplot’s geom_tile,
it is possible to generate a heatmap based on the cohorts.
# Triangle heatmap to compare cohorts
ggplot(rcohorts, aes(cohort, tenure)) +
    ggtitle('Retention by cohort') +
    theme_bw() +
    xlab('Cohort') +
    ylab('Tenure (weeks)') +
    geom_tile(aes(fill = value), color='white') +
    scale_fill_gradient(low = 'white', high = 'darkblue', space = 'Lab') +
    theme(axis.text.x=element_text(angle=90),
          axis.ticks=element_blank(),
          axis.line=element_blank(),
          panel.border=element_blank(),
          panel.grid.major=element_line(color='#eeeeee'))
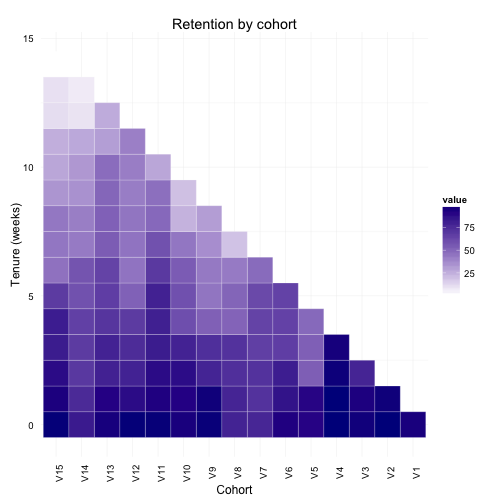
With real data, it is easy to spot anomolies, leading to areas for further investigation. For example, why did users who signed up in a particular week retain better than other weeks.
Danny Ferante explains further ways of reading the heatmap in the video.
I find the heatmap much easier to read than just plotting the cohorts:
ggplot(rcohorts, aes(tenure, value)) +
    theme_bw() +
    geom_point(aes(color=cohort))
